Know Your Costs
Notice we didn’t say “Know Your Fees”?
Investors often make the mistake of only knowing their fees. Far more impactful are one’s costs. Costs include fees, as well as many other factors that can hurt your rate of return and chances of success. Ultimately, you should only pay for that which adds more value than it costs.

Costs You Can See
(and probably know about)
Costs You Can’t See
(and probably don’t know about)
Advisory Fees vs. Commissions
(and other hidden compensation)
What’s the Difference?

The Good
Advisory Fees
You have a right to know, and should know, what you are paying your advisor. The best way to accomplish this is to find a Fee-Only advisor (not to be confused with “fee-based”). This way, what you pay – the advisory fee – will be clear and transparent, as the only compensation of any kind your advisor will receive will come directly from you. Your exact advisory fee will differ depending on which firm you choose (see chart below).

The Bad
Commissions
You should never pay a commission. Period. These upfront payments incentivize the advisor to steer clients towards expensive investments (especially annuities) and frequent trading, neither of which is beneficial to investors. Moreover, there are simply no commissionable investment products that are better than the commission-free options available through an independent, fee-only fiduciary.

The Ugly
Hidden Compensation
Many advisors work at firms where bonuses, trips, perks, and kickbacks from selling certain investment products are valued far more than giving objective, sound advice. These payments are rarely, if ever, disclosed, and pose an obvious conflict of interest. Worst of all, one way or another, you are paying for them.
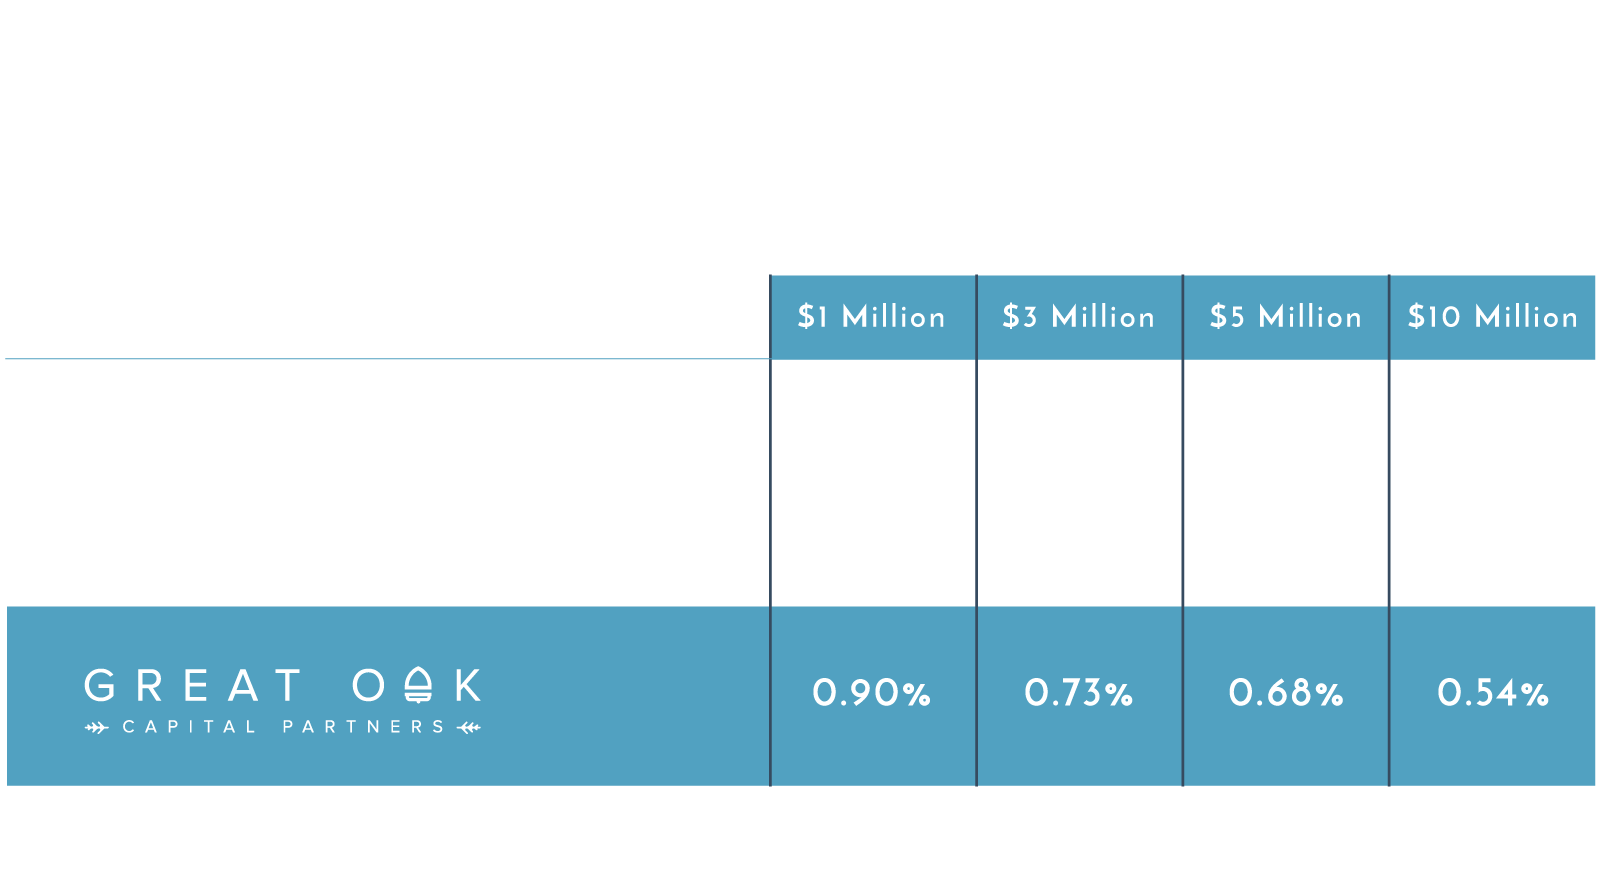
As Fee-Only fiduciary investment advisors, we accept no commissions, no perks, no trips, no bonuses, and no kickbacks. Only merit, not compensation, guides our recommendations. We have no products to sell – only advice. Our only revenue comes from you, our client, at a far lower rate than other advisors. See our full fee schedule here.
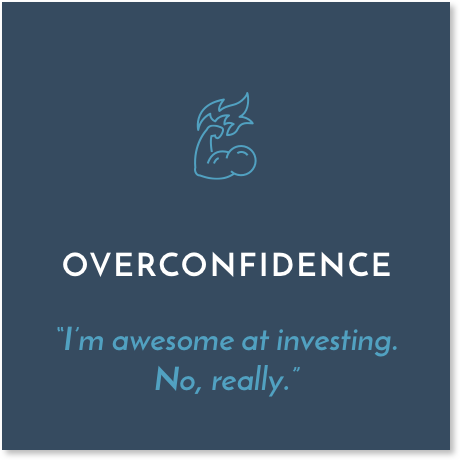
The Cost of Being Human:
Behaviors and Biases
For some, this issue will cost little; for others, it may cost them everything. At some point, it will affect all investors. A study by Vanguard1 claims the average investor loses 1.5% per year to preventable mistakes. Either way, in light of these behaviors and biases, the crucial role of discipline and objectivity in investing becomes clear.
1Francis M. Kinniry Jr., et al., Putting a value on your value (2014)
HOVER ON EACH TO FIND OUT MORE

Our Evidence-Based Investment Approach, deeply rooted in science and academia, replaces emotion with logic, objectivity, and discipline, and inherently does not allow for these behaviors and biases, saving our clients that 1.5% – and quite often much more.
What Your Mutual Funds
REALLY Cost
(Hint: It’s more than the expense ratio)
The Expense Ratio
The expense ratio, which most people are familiar with, is a number expressed as a percentage, easily found on any financial website (like Morningstar) or prospectus. This number represents the explicit cost of a fund.
But There’s More
Not included in the expense ratio are these hidden costs: bid/ask spreads, brokerage commissions, and price impact costs. Collectively, for most funds, they add up to more than the average expense ratio.
That’s Still Not It
The average fund keeps about 5% of its assets uninvested1, just sitting in cash. Given that equities have historically outgrown cash by about 6% per year2, every dollar kept as cash costs you money – what we call “cash drag”.
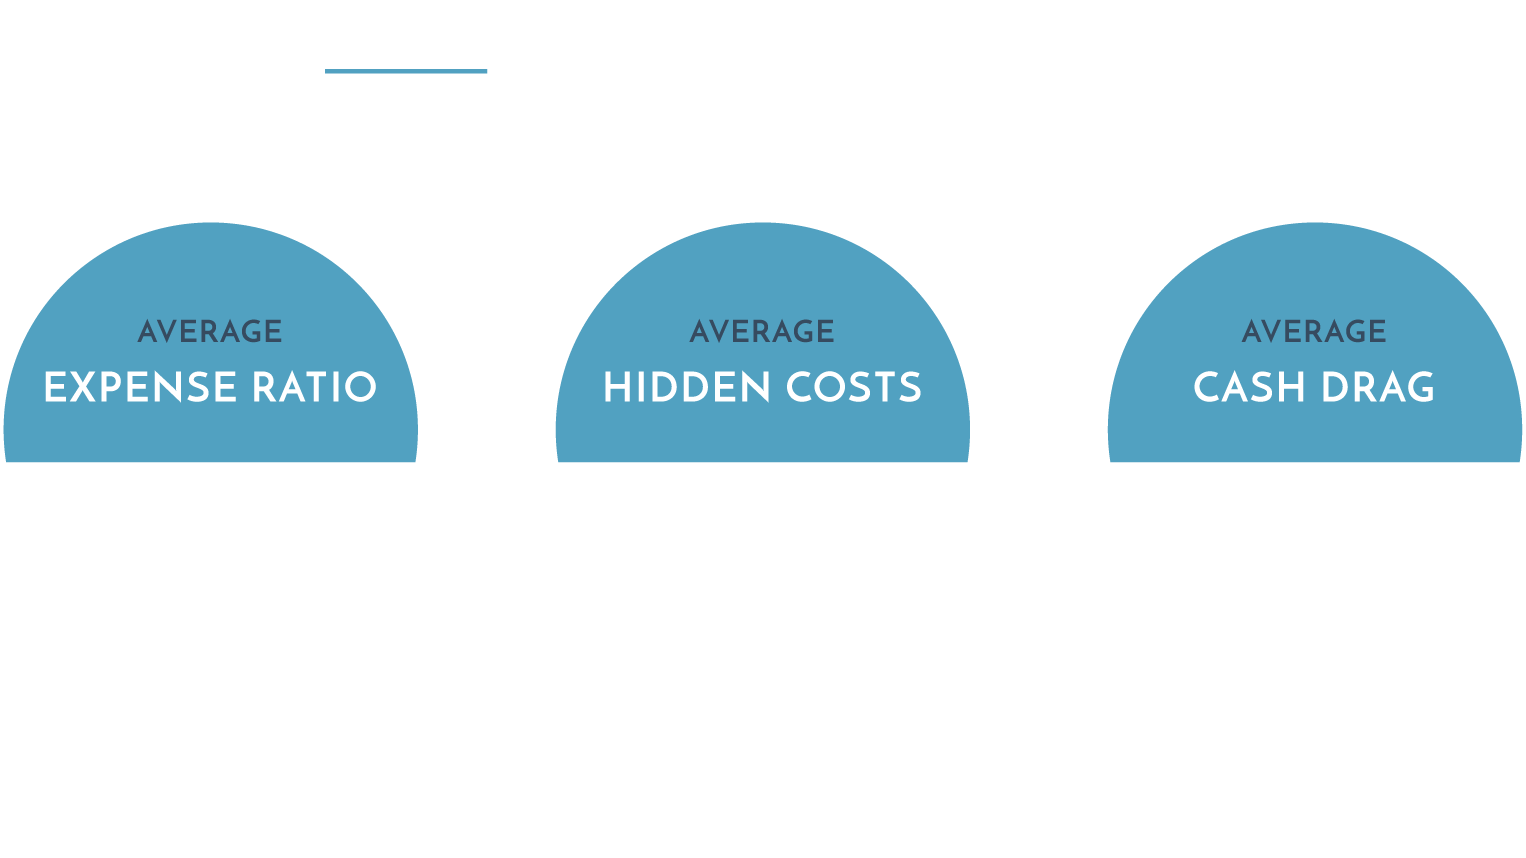
We only recommend funds that have low expense ratios, low cash holdings, and are engineered to minimize any hidden costs. As of March 2022, our average diversified portfolio had an expense ratio of 0.27%.
Taxes: The Cost of
Turnover and Trading
The more mutual funds buy and sell (turnover) and the more investors buy and sell (trading), the more likely investors will generate capital gains taxes.
When Does This Matter?
Don’t Worry.
These Accounts Are Tax-Deferred:
Traditional, Inherited and Roth IRAs
SEP and Simple IRAs
401k, 403b and 457
Be Mindful.
These Accounts Are Currently Taxable:
Individual, Joint and TOD
Trusts
Custodial
Decades of evidence and data tell us that frequent trading and high turnover do not add value. In fact, it’s quite the opposite. According to Morningstar, the tax inefficiency of the average mutual fund (read: actively managed funds) costs investors 1.1% each year in taxable accounts1. Add to that any trading an investor does, and the tax bill becomes quite a burden.
1https://news.morningstar.com/articlenet/article.aspx?id=373782
Our commitment to the Evidence-Based Investment Approach assures our clients that the funds we recommend have very low turnover, and that we only trade when it’s absolutely necessary (typically for yearly rebalancing) – significantly reducing our clients’ tax burden.
The Cost of Ignoring Science:
Factor Investing
Like physics, chemistry, and math, investing is a science. The body of peer reviewed, unbiased research and evidence supporting this branch of science is vast and deep. One very important lesson science has taught us is that stocks and bonds can be categorized to our advantage. These categories, which tend to produce different results from each other, are called “factors”.
For example, the “small cap factor” represents the difference in return between small company stocks and large company stocks. Most people don’t know there’s a difference. There is, and it’s significant. Take a look…
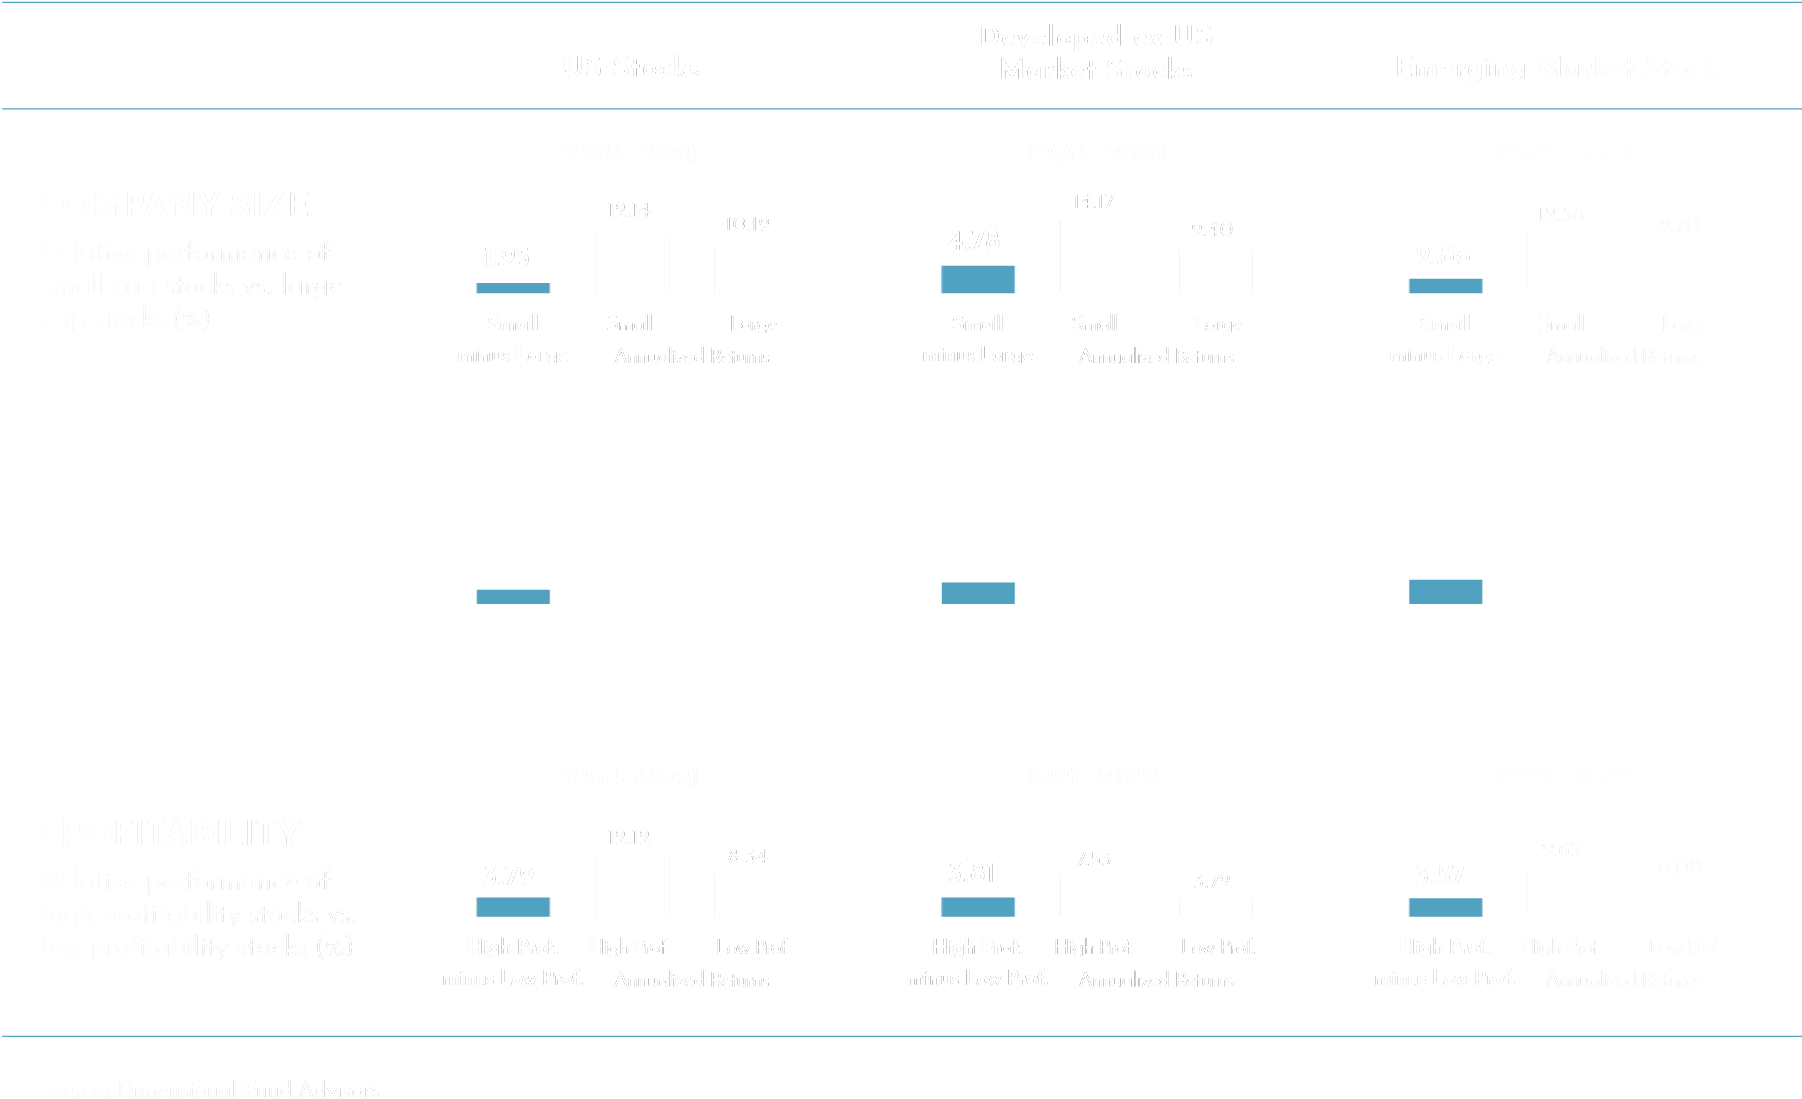
These numbers are quite significant. Ignore them, and your portfolio may suffer. Consider this data:
In all our years, most people we’ve met had a portfolio that looks much like the S&P 500, with very little exposure to factors. Do you see why that’s a problem? Make no mistake – not doing something beneficial is just as much a cost as doing something harmful.
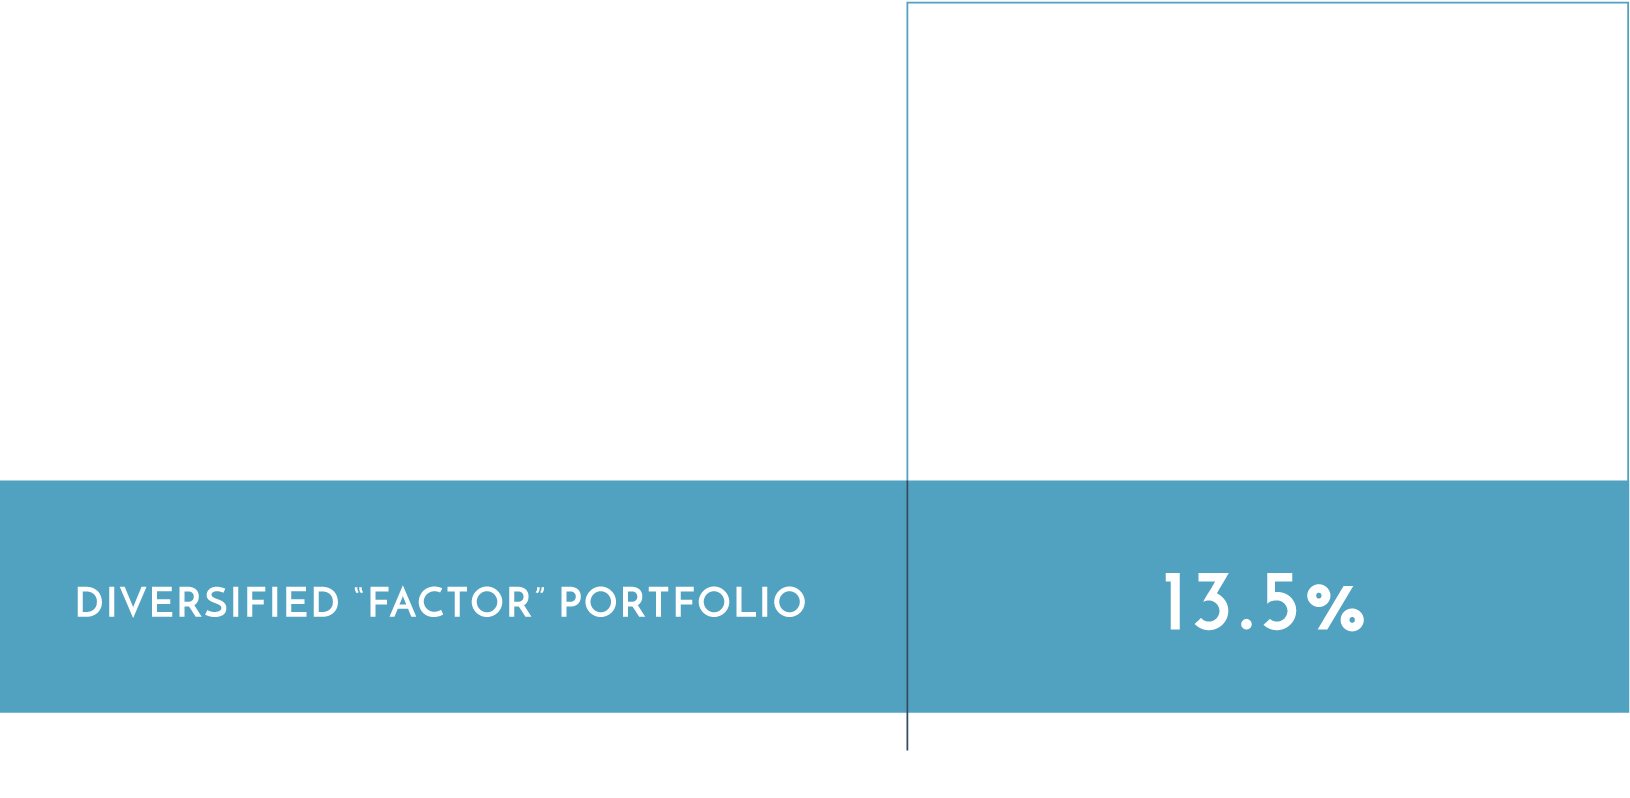
Factor investing is a core dimension of the Evidence-Based Investment Approach, which we employ for our clients. Every portfolio we construct integrates factor exposure through low-cost, tax efficient funds.
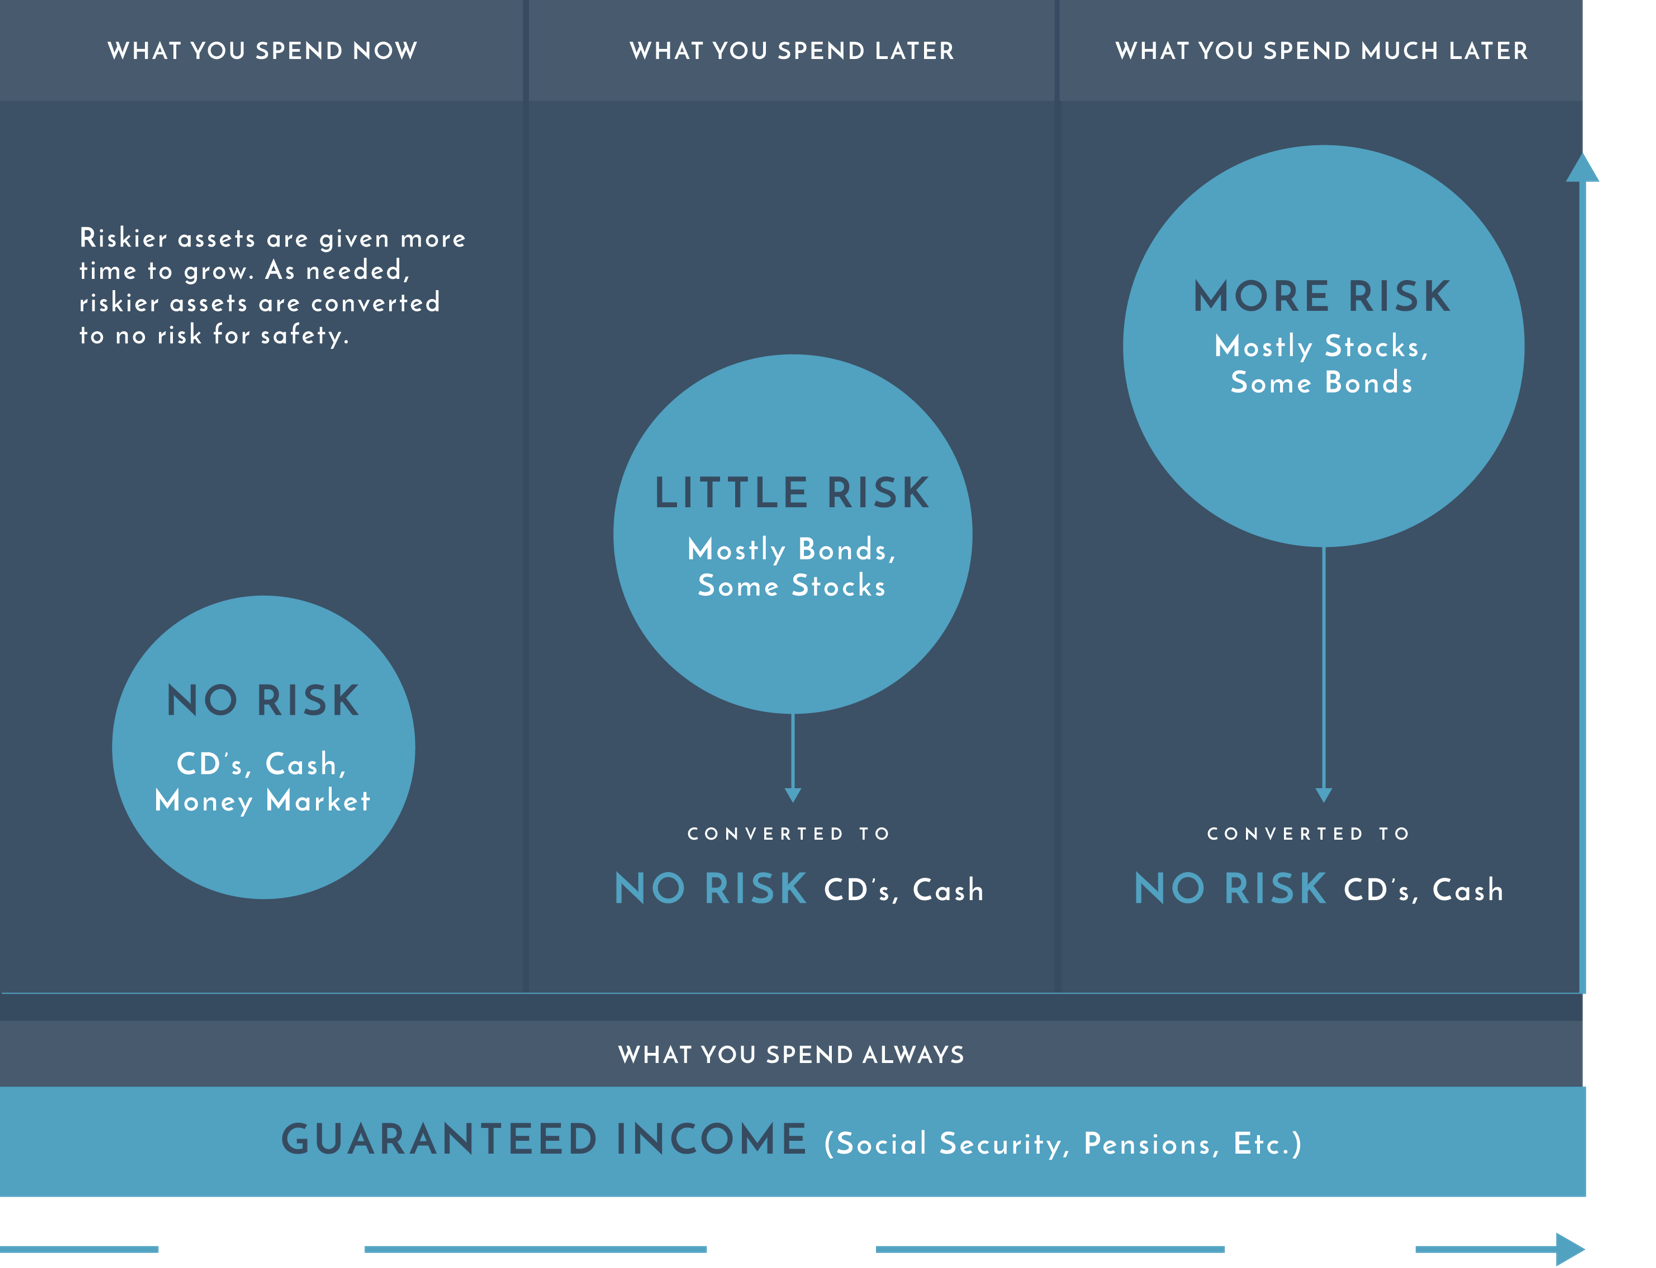
An Extra Cost for Retirees
How Your Sequence of Returns
Can Cost You Everything
Jack and Elaine both have a million dollars. They want to each withdraw 7% – or $70,000 – each year. They believe they can average a 7% return. Sounds like they’ll breakeven in the end, right? Let’s see…
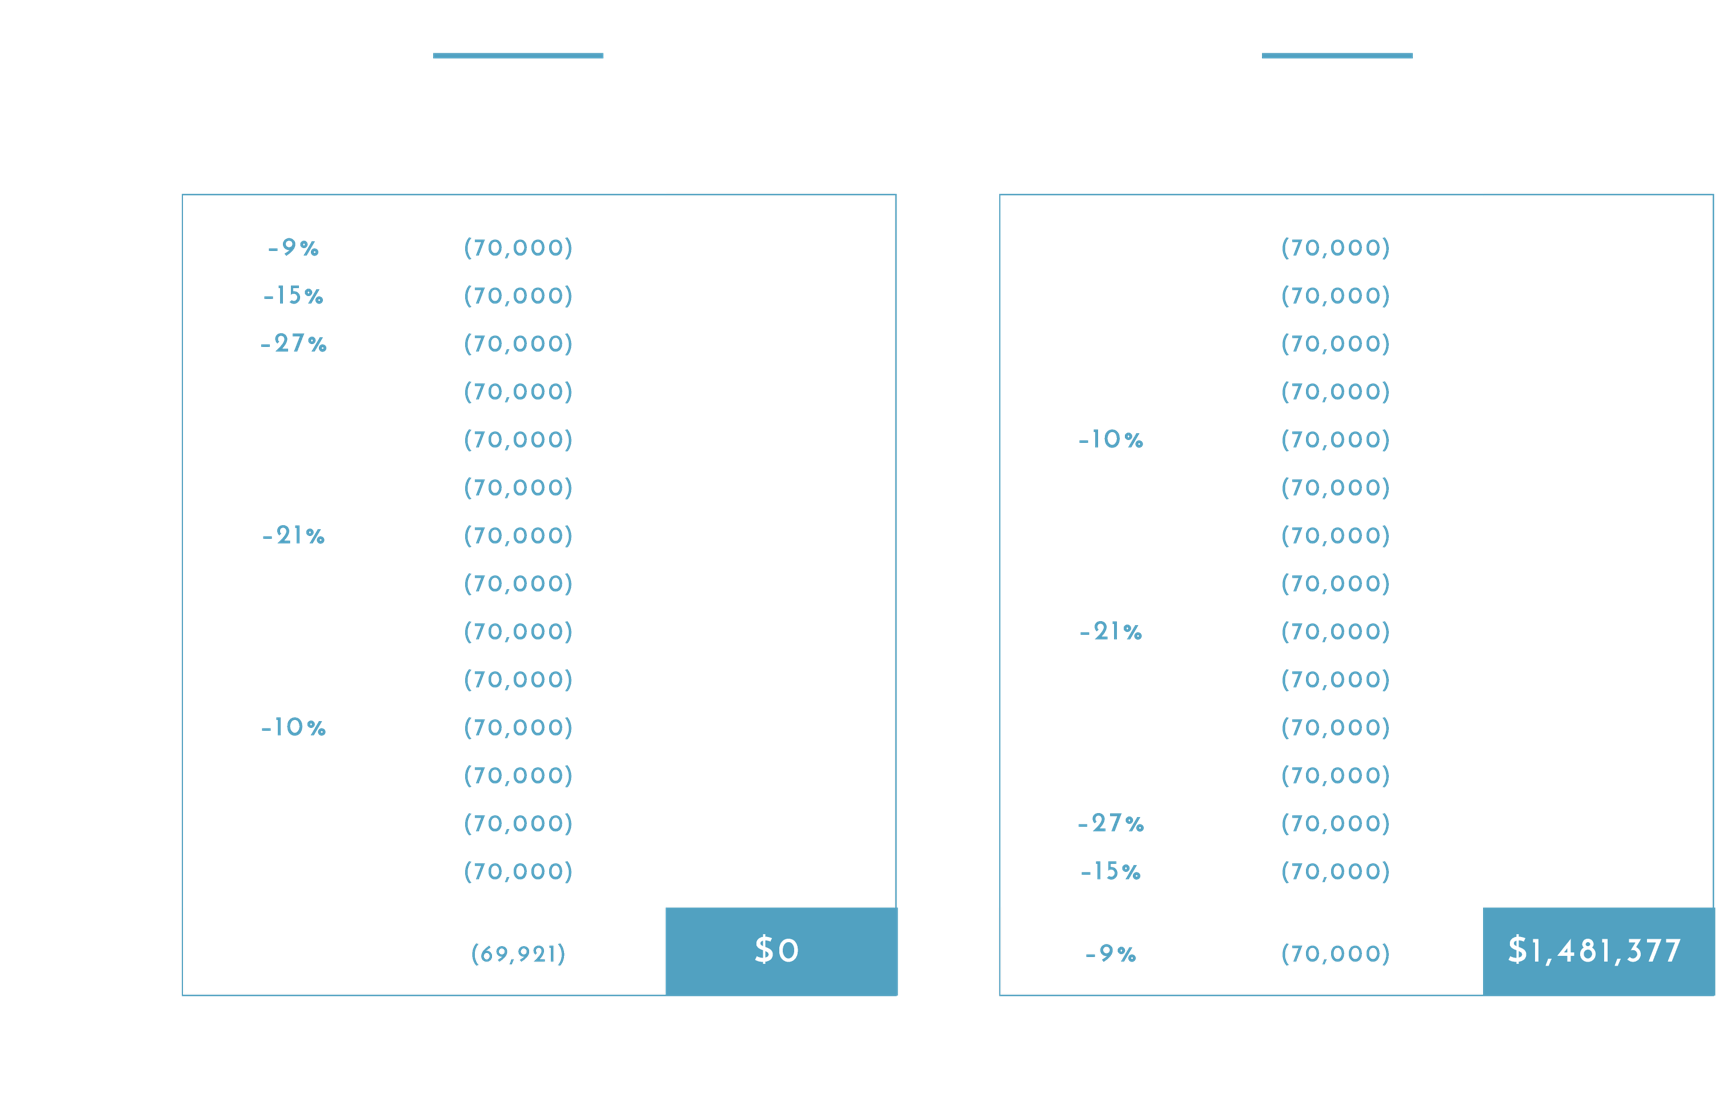
What happened?
Same withdrawal amounts, same compounded return. In fact, they had the same annual returns, just in the opposite order. Yet, Elaine ran out of money, while Jack’s grew. Although their returns were the same, the sequence of returns was not. Elaine experienced negative years early on. Down markets plus withdrawals can equal disaster. Thus, any money pegged to be spent soon should never be put at risk.
Our “bucket” approach makes sure that the money you need to spend today isn’t at risk in the market, while the money for later years is positioned for growth. This process removes the sequence of returns problem. Here’s how it works…