A Look at Daily Market Returns
Our last piece on market volatility prompted questions about the ranges of market returns, particularly in a given day. We collected Dow data from 1928 through yesterday to get the answer. Take a look…
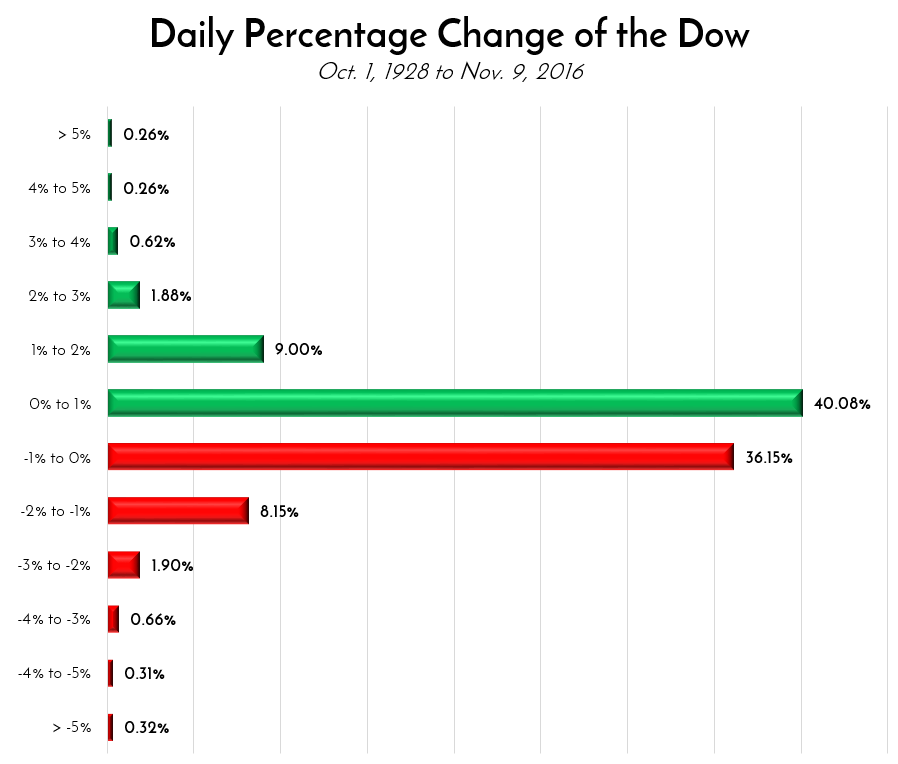
This graph represents 22,130 days of daily returns, most of which were uneventful, with the Dow moving no more than 2% either up or down. Only about once every three weeks on average do we experience a daily return greater than 2%, whether it’s positive or negative. The worst day was “Black Monday”, October 19, 1987, when the index dropped 22.61%. The best was 15.34% on March 15, 1933, during the Great Depression.
There’s a lesson in this data. Anything can happen, has happened, and will happen. Yet, despite all the ups and downs, and the seemingly even split between up days and down days, today marks an all-time high for the Dow index. So the lesson? In investing, time is your ally, and it increases your chances of success. Short-term “investing” is nothing but a gamble.
Cheers,
John & Bill