With all the talk in the financial media about a “looming recession”, we thought we’d share some facts about them:
The definition of a recession: The National Bureau of Economic Research (NBER) is generally recognized as the authority that defines the starting and ending dates of U.S. recessions. They state that a recession is a significant decline in economic activity spread across the economy, lasting more than a few months, normally visible in real GDP, real income, employment, industrial production, and wholesale-retail sales.
The “other” definition: In 1974, economist Julius Shiskin defined a recession as two consecutive quarters of declining GDP. You’ll hear this a lot in financial media.
The average recession since WWII lasted about 10 months.
The last one – the “Covid recession” – was the shortest in U.S. history at only two months.
The longest began in 1873 and lasted 65 months.
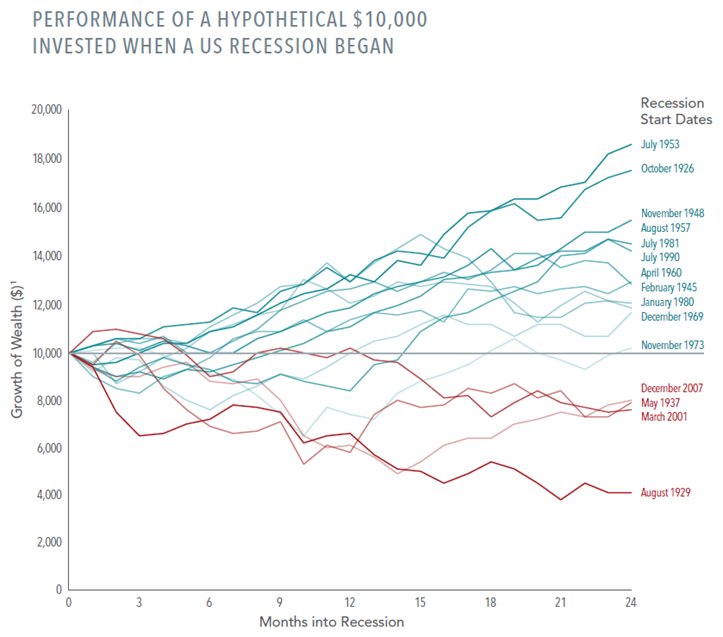
How U.S. stocks fared two years after a recession began…
Growth of wealth for the Fama/French Total US Market Research Index
The average annualized return two years after the onset of these recessions was 7.8%.
Since WWII, throughout 13 recessions, the S&P 500 increased by an average of 5.1% during the recessions. (Yup, really)
Since WWII, the S&P 500 decreased by an average of 8.4% during the time between its peak and the start of the recessions.
The message here is that recessions are lagging indicators of stock market performance. By the time a recession occurs, the market is already looking beyond it toward a recovery. Or, the recession never happens. Either way, the path to long-term success doesn’t change: don’t time the market, stay disciplined, and be patient.
Cheers,
John, Bill, Mark & Melanie

