Can you guess what this represents?
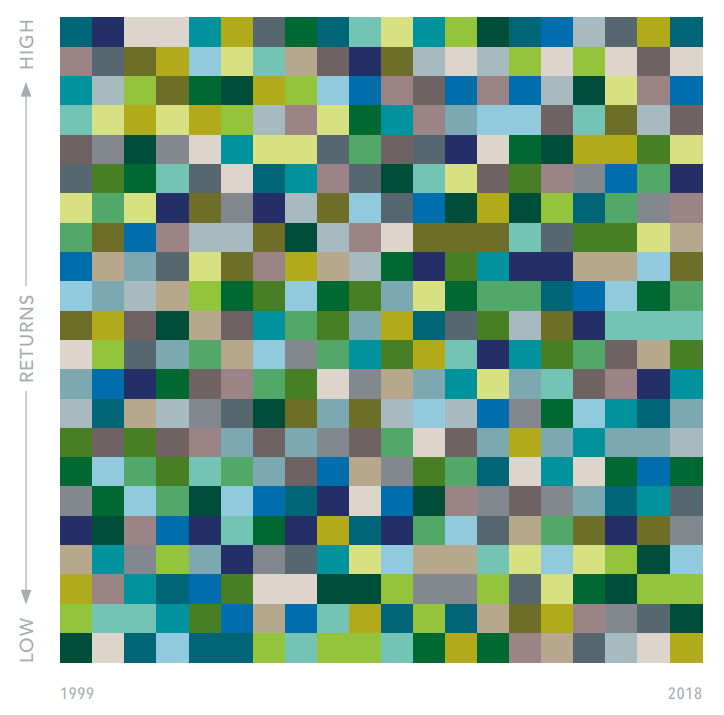
This table illustrates 20 years of annual equity returns for developed markets. Each color represents a different country. Each column is sorted top down, from the highest-performing country to the lowest.
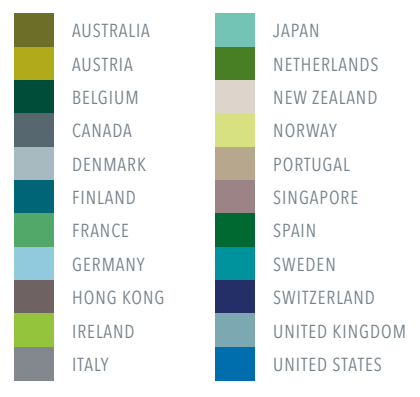
Here’s how the colors match to the countries:
Why is this important?
Pick a color in the first column and follow it through to the right. Does any country seem to follow a pattern that gives clues about its future performance? Not at all.
But that won’t stop us from trying to find one. It’s in our blood. Psychologists call it the “Gambler’s Fallacy”, the idea that we as humans seek patterns and causality in events to make sense of the randomness of things – in this case, the randomness of markets.
Let’s dig deeper. Here, we isolate the U.S. in blue, and Denmark in gray. Can you guess which country had the higher return over the last 20 years?
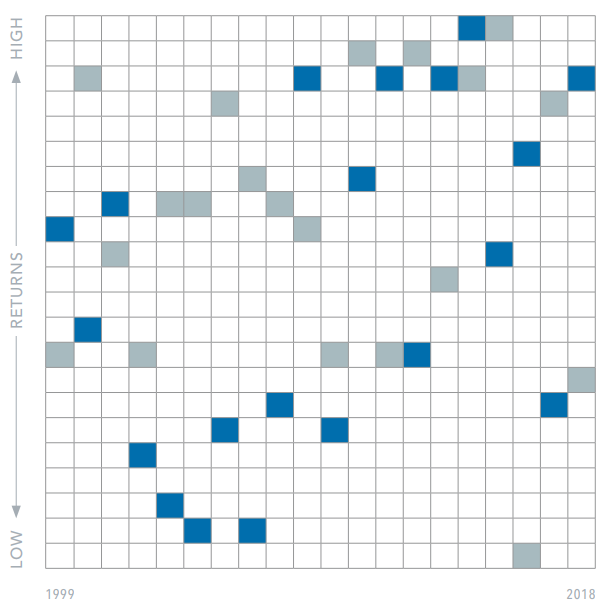
Denmark, in fact, was the best performer among all developed markets, with an annualized return of 9.1%. Surprisingly perhaps, Denmark had the best calendar year return only once, in 2015 (followed by the worst return the next year!). The US, despite some strong returns in the last several years, placed ninth overall with an annualized return of 4.9%.
We are sometimes asked why we invest in foreign markets. Why not just invest in the U.S.? Now you know. A good or bad stretch of returns by any country has no bearing on what the future will bring. By diversifying across the globe, we capture the performance of the global markets, which can deliver more reliable outcomes with less volatility, helping you stay on track.
Cheers,
John, Bill, Mark and Melanie