What a Tough January Means to the Market
At lunch time on January 20th, the S&P 500 index was down 11.3% for the month, on its way to the worst January return ever. By month’s end, it settled at negative 4.93% – a welcomed paring, but a shot in the gut nonetheless. It was the ninth worst January for the index since 1926, and the worst two-week start ever.
We’ve heard rumblings that this descent portends disaster for the rest of the year. The best way to determine this is by using the data. Take a look…
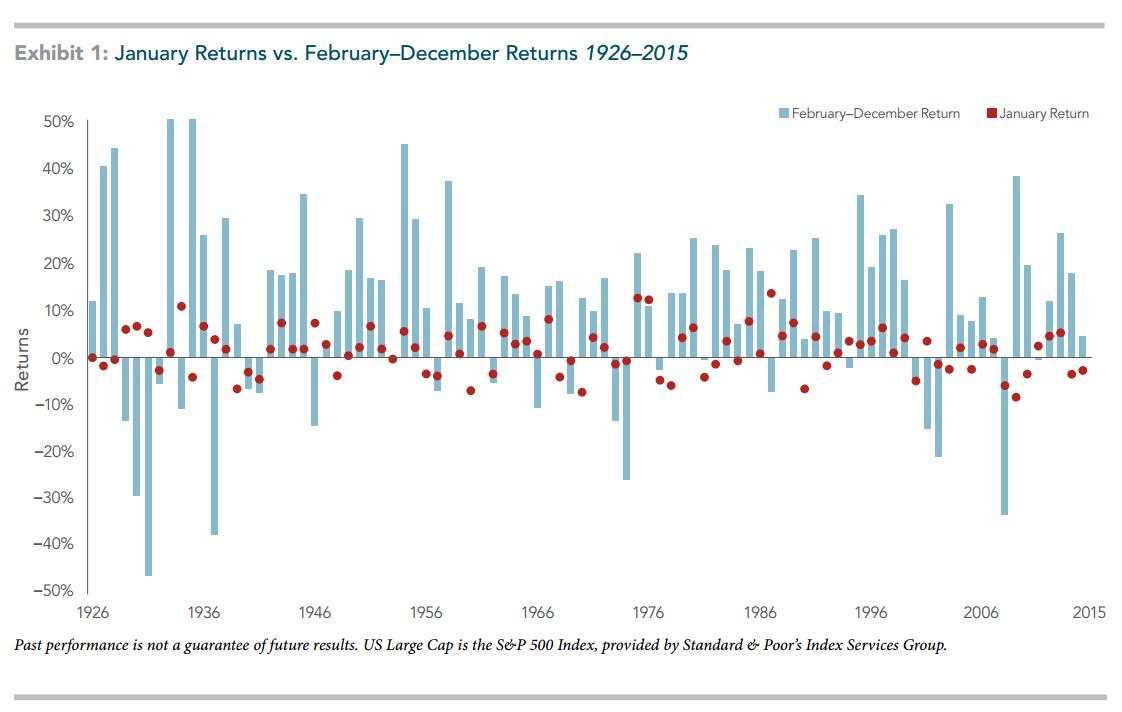
No need to start counting dots. We’ve done that for you. A poor January was followed by a subsequently positive 11-month return (February through December) 60% of the time, with an average return of 7%. Thus, a negative January does not predict poor returns for the remainder of the year. What is sure is that people will continue to make predictions, regardless of the facts. Warren Buffet said it best:
“A prediction about the direction of the stock market tells you nothing about where stocks are headed, but a whole lot about the person doing the predicting.”